+ Reply to Thread
Results 1 to 3 of 3

Thread: Couple of questions: EV graph changes during the day / EV for ADR shares

  1. #1
    Join Date
    Jun 2013
    Location
    Fort Lauderdale, FL
    Posts
    15

    Couple of questions: EV graph changes during the day / EV for ADR shares

    Please allow me a couple of newbie questions:

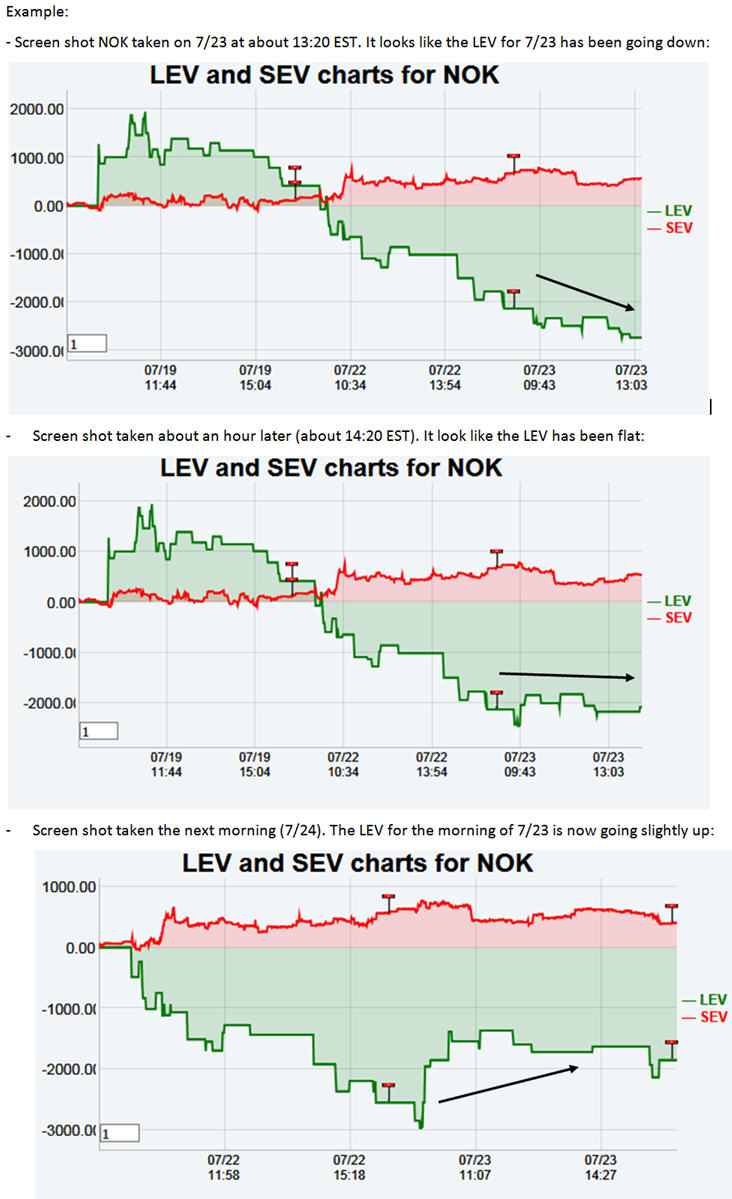
    1) I noticed that the RT EV graph changes during the day. What is the reason for that? (Example attached below)

    2) Does it make sense to use LEV for ADR shares, given that the main trading venue is outside the US?

    Example: the US price of Nokia (NOK) seems to mostly just follow the market in Helsinki until Europe closes at 11:30 AM EST. In the US only 13% of the shares for NOK are held by institutions ( http://www.nasdaq.com/symbol/nok/ownership-summary ) .

    Could the EV for just the US market give a misleading picture without the EV data for the European market?

    Thanks!
    Karin

    Name:  Example changing NOK EV 3.jpg
Views: 3781
Size:  129.9 KB

  2. #2
    Quote Originally Posted by Karin View Post
    Please allow me a couple of newbie questions:

    1) I noticed that the RT EV graph changes during the day. What is the reason for that? (Example attached below)

    2) Does it make sense to use LEV for ADR shares, given that the main trading venue is outside the US?

    Example: the US price of Nokia (NOK) seems to mostly just follow the market in Helsinki until Europe closes at 11:30 AM EST. In the US only 13% of the shares for NOK are held by institutions ( http://www.nasdaq.com/symbol/nok/ownership-summary ) .

    Could the EV for just the US market give a misleading picture without the EV data for the European market?

    Thanks!
    Karin

    Attachment 19277
    Hi Karin,

    These are very good questions.

    First, the EV figures change as the day evolves, because the small/large distribution is recalculated every minute, from the start of the day in order to always keep 50% of all the number of shares in each group.
    You will note that TEV never changes, because TEV = LEV + SEV.

    If LEV suddenly falls while it had been increasing, it means that large sellers came in more recently and the large "sell" volume that we saw at the start of the day became small sell volume. If you day trade stocks or work with options, this is important information. If you are a position trader, then it is better to wait for a late afternoon view of the LEV pattern in order to take a new position.

    Regarding companies that are mainly traded abroad (ADR), you are right to state that LEV is much less reliable.
    This is also the reason why I have included the Canadian market, because many commodities linked stocks are traded both in the US and in Canada.


    Pascal
    Last edited by Pascal; 07-24-2013 at 04:23 PM. Reason: spelling error

  3. #3
    Join Date
    Jun 2013
    Location
    Fort Lauderdale, FL
    Posts
    15
    Thanks for the quick reply and the explanations!

+ Reply to Thread

Posting Permissions

  • You may not post new threads
  • You may not post replies
  • You may not post attachments
  • You may not edit your posts