6-22-12 Comments
Yesterday the NASDAQ closed more than 0.2% below the 21-day ema and signaled an S5 sell signal bringing the exposure count down to +1 (30% invested). We barely missed an S10 bad break sell signal which happens on a 2.5% down day. IBD placed the market condition to: Market Under Pressure.
I liquidated ALGN and FIRE but remain in KORS, TDG, AAPL and N. All of these are half-sized (10%) positions. This means I am slightly overexposed at 40% invested. I had taken a position with a pocket pivot on June 6 in MLNX but on 6-20 I sold and took profits because the LEV situtation was showing substantial negative divergence. I find that Effective Volume is useful to help choose what to do with the portfolio when it comes time to choose which stocks to jetison and which stocks to buy given a multiple choice situation. The eSignal EV script works well for those stocks that are not in the EV database. It takes approximately 15-20 seconds to run largely I believe because the minute data for 120 days (46,800 price and volume data points) takes that much time to download from the eSignal server. I believe this script is server data restricted because eSignal only takes 15% of CPU resources when running EV.
As far as to where the market goes from here, I have no opinion. I have done some recent research into methods proposed in 1971 by Richard Arms in his book Profits in Volume. He wrote the following two statements:
1. The volume that is generated in the building of a base is almost exactly the volume disapated in the ensuing advance.
2. The volume occuring in a top formation is very close to the same as the volume in the subsequent decline.
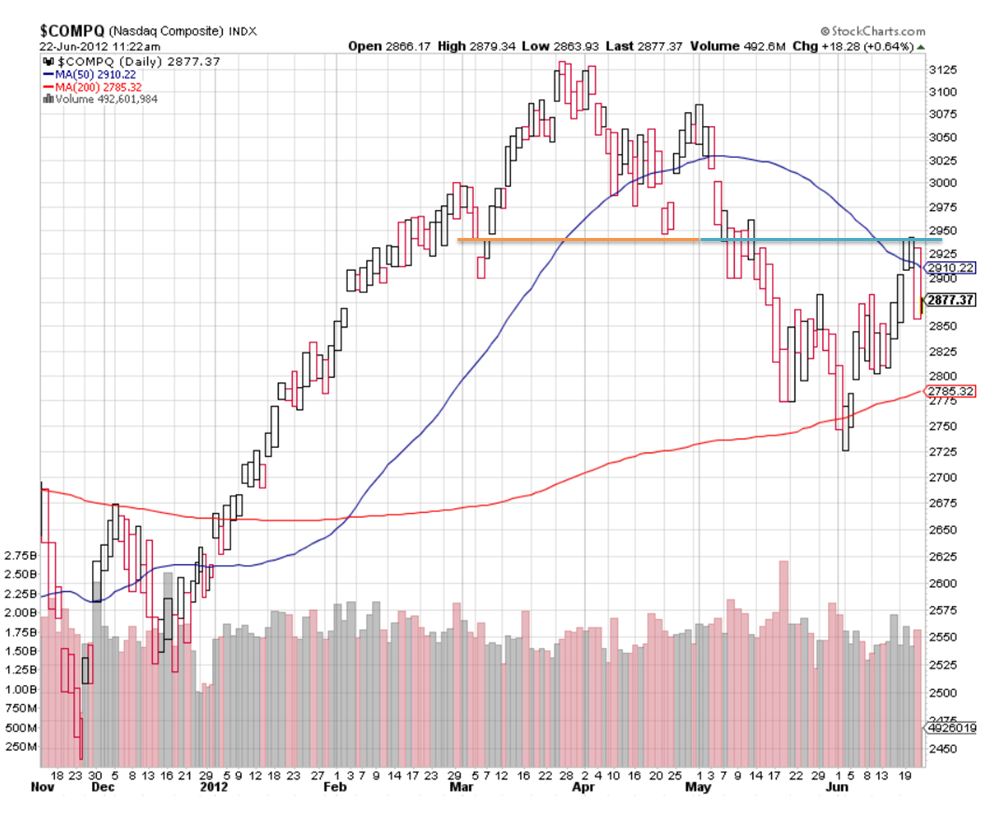
I offer this view of the NASDAQ on an equivolume chart. An equivolume chart is linear in volume on the X axis and not linear in time. The orange line is my estimate of the total volume contained in the topping structure. The blue line is exactly equal in length of the orange line and thus equal to the same volume as the orange line. You can see that we are within one or two days of completing the volume condition in statement #2 above. From here we don't know the direction the market may take but if Arms is correct, expect a change from sideways to a leg down or up beginning soon.

Mike Scott
Cloverdale, CA


 Reply With Quote